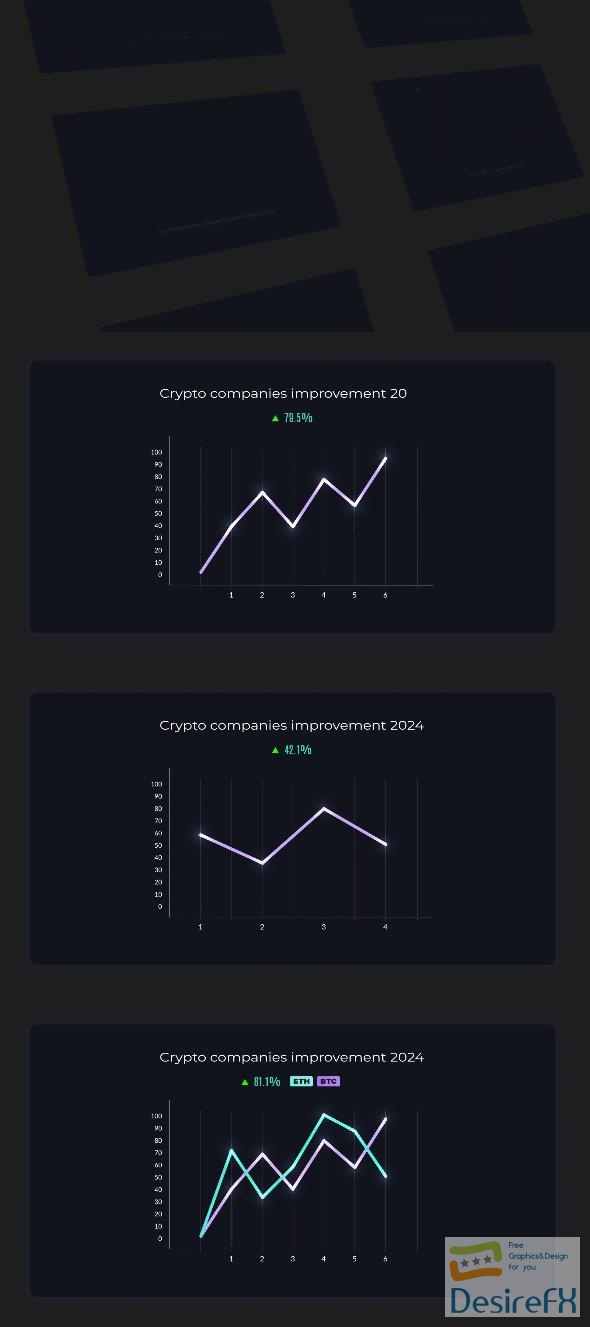
VideoHive Line Graph Chart Infographics 50381564

Line Graph Chart Infographics are enhanced by universal expressions, meaning they work seamlessly across all language barriers. Support is readily available around the clock, enhancing the user experience. Moreover, any updates released in the future come at no extra cost. This responsive and dynamic tool empowers creators to produce polished, professional-looking visual data, essential for presentations, reports, and digital content.
Features of Line Graph Chart Infographics
Visual data representation is key in disseminating information effectively, and ‘Line Graph Chart Infographics’ offers an innovative approach to creating dynamic and engaging graphics. These infographics are designed to work seamlessly with After Effects, providing a versatile tool for professionals and enthusiasts alike who wish to present data in a visually appealing manner.
- Universal Expressions: The infographics package includes universalized expressions that ensure compatibility with any language, eliminating any potential barriers in data presentation.
- No Keyframes Necessary: Ease of use is a standout feature, with no keyframes required. This streamlines the animation process, making it accessible even to those with limited experience in animation.
- Duration Control with Marker: Users have complete control over the duration of the graph animations thanks to an intuitive marker system, allowing for precise timing adjustments to suit the pacing of any project.
- Scalability: The infographics are designed to scale up to 8k resolution without any loss in quality, ensuring that they remain sharp and clear in high-resolution outputs.
- Video Tutorial Included: To assist users in getting the most out of this tool, a comprehensive video tutorial is included, guiding them through the creation process step-by-step.
- Free Font Included: The package comes with a free font, with links provided, adding to the aesthetic consistency of the presentations created.
- User-Friendly: The tool is designed with ease of use in mind, allowing users to efficiently create line graph chart infographics without the need for extensive technical knowledge.
- Separate Project Files: For users with less powerful computers, all compositions are saved as separate projects to ensure that they can be worked on without straining system resources.
- No Plugins Required: There is no need for additional plugins, making this a self-sufficient tool that is ready to use upon download.
- 24/7 Support: The product comes with around-the-clock support, ensuring that any issues can be addressed promptly, providing users with continuous assistance.
- Free Future Updates: Investing in this package is future-proof, as all upcoming updates are provided at no additional cost, keeping the tool relevant and updated.
This set of infographics is crafted to meet the needs of presenters, companies, and content creators who demand clarity, flexibility, and professionalism in their data visualization tools. With features aimed at enhancing productivity and presentation quality, ‘Line Graph Chart Infographics’ stands as a valuable asset in any visual communicator’s toolkit.
How to use Line Graph Chart Infographics
Creating engaging and informative data presentations just got easier with the Line Graph Chart Infographics template for After Effects. This dynamic template allows users to craft compelling line graphs that can enhance any video project with data visualization. Ideal for illustrating trends, showcasing statistics, or simply bringing numbers to life, this template streamlines the process of creating professional-looking infographics.
Before you start, ensure After Effects is installed on your computer and that you have basic familiarity with its interface. Open a new project and import the Line Graph Chart Infographics template. Your starting point will be the template’s customizable options, where you can input your data, adjust grid numbers, and tweak line colors and styles to suit your project’s aesthetics.
Unique to this template are features like the easy-to-animate points, which smoothly transition from one data set to another, and the option to adjust the thickness and progression of your lines with just a few clicks. This user-friendly approach ensures that you can create sophisticated animations without extensive knowledge of After Effects.
Step by step, begin by customizing your graph’s data set, then move on to animate your lines, previewing your work as you go. If you encounter any issues, remember that it’s often just a matter of adjusting a few settings – no need for concern.
Your readers will appreciate the clarity and precision with which you can present complex data using this template. By maintaining a focus on simple, straightforward instructions and avoiding jargon, you’ll help ensure that After Effects users of all skill levels can successfully utilize the Line Graph Chart Infographics template to elevate their video content.
Line Graph Chart Infographics Demo and Download
Experience the simplicity of creating dynamic line graph chart infographics with the After Effects template designed to elevate your presentations. The pack features seven distinct line graph charts, each brilliantly crafted to enhance data visualization without requiring any plugins. The intuitive design ensures that all expressions are universalized, guaranteeing compatibility with any After Effects language version.
Remarkably, you won’t grapple with keyframes or quality loss—even when scaling up to 8K resolution. For ease of use, each composition is saved as a separate project, ensuring smooth operation on various computer strengths. A video tutorial is included, alongside a free font link, making it easy for beginners to craft professional-looking charts. This template provides not just a powerful visual tool but also promises around-the-clock support, ensuring any queries are swiftly addressed.
Ready to bring your data to life with these infographics? Head over to DesireFX.COM where obtaining this After Effects template is a breeze. The website is trusted for its reliable and secure download process, ensuring you get what you need without a hitch. Simple, fast, and user-friendly— DesireFX.COM is your gateway to high-quality visual content.
